

Here are the latest charts and analysis in the market today. Check them out.

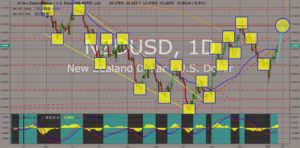
NZDUSD
The pair was seen to continue its rally after the crossed over of MAs 50 and 200 created the”Golden Cross”. As the United States pulled itself from global accords and isolate itself from the rest of the world, it was now missing the opportunities created to counter his trade war. Trump pulled out from the symbolic 12-nation trade deal that was a linchpin of former US President Barack Obama’s Asia policy. Now the 11 countries are going to continue the trading agreement with the improved CPTPP (Comprehensive and Progressive Trans-Pacific Partnership), which will officially start on March 01, 2019. The idea of China joining the trading bloc receives optimism from investors as China poised to become the world’s largest economy by 2021. Aside from CPTPP, New Zealand had also expressed its willingness to make trading agreement with the United Kingdom once it officially withdraws from the European Union on March 29, 2019. Histogram and EMAs 13 and 21 will continue to go up.
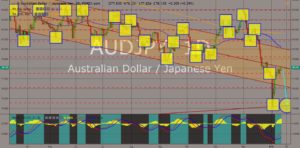
AUDJPY
The pair was expected to reverse after hitting a resistance line with the downward channel’s middle line. Both countries will lead the ratified CPTPP (Comprehensive and Progressive Trans-Pacific Partnership), which will be took effect on March 01, 2019. Australia will face an election on or before May 18, 2019, but was widely expected that the incumbent Prime Minister, Scott Morrison, will lose in the election. Meanwhile, Japan Prime Minister Shinzo Abe won the ruling party leadership vote last September 20, 2018, that makes him Japan’s longest serving premier and try to cement his legacy of revising the country’s pacifist, post-war constitution. Japan’s new defense policy will add its first aircraft carrier since World War II with Ministry of Defense to spend at least $240 Billion. It also recently banned Huawei’s 5G technology. Japan also ratifies its EU-Japan Free Trade Agreement, which will account to 1/3 of Global GDP. Histogram and EMAs 13 and 21 was expected to reverse.
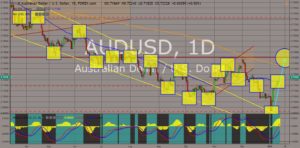
AUDUSD
The pair’s rally was expected to be sustained in the following days after it passed out of MA 50. The United States was now in the headlines after report shows the US will slide to the third spot of the world’s largest economies, behind China and India. The isolation and trade war created by the United States is hitting back, as the United States watches the ratification of CPTPP (Comprehensive and Progressive Trans-Pacific Partnership), with the possibility of China to replace the United States’ post after it withdraw last year, January 17, 2017. Australia was also taking advantage of the crisis in Europe by proposing to the United Kingdom of a bilateral trading agreement, or even the possibility of integrating CANZUK (Canada-Australia-New Zealand-United Kingdom). Histogram and EMAs 13 and 21 will continue to go up.
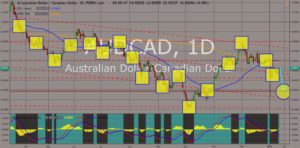
AUDCAD
The pair will continue to go lower in the following days, despite the crossed over of MAs 200 and 50 that created the “Golden Cross”. Both countries are trying to enter a bilateral trading agreement with China, although the two countries opposed China’s military expansion in the South China Sea. The two countries are members of the ratified CPTPP (Comprehensive and Progressive Trans-Pacific Partnership), which aims to counter Trump’s protectionism, and members of the Five Eyes Intelligence Alliance, that will counter any efforts by Chinese spy unit in meddling with each country’s affairs. However, Australia will face an impending 2019 Australian Federal Election on which the incumbent Prime Minister Scott Morrison was expected to lose, which will further dim the country’s future and leadership. Histogram and EMAs 13 and 21was seen to continue the downtrend.


COMMENTS