

Here are the latest market charts and analysis for today. Check them out and know what’s happening to the market today.

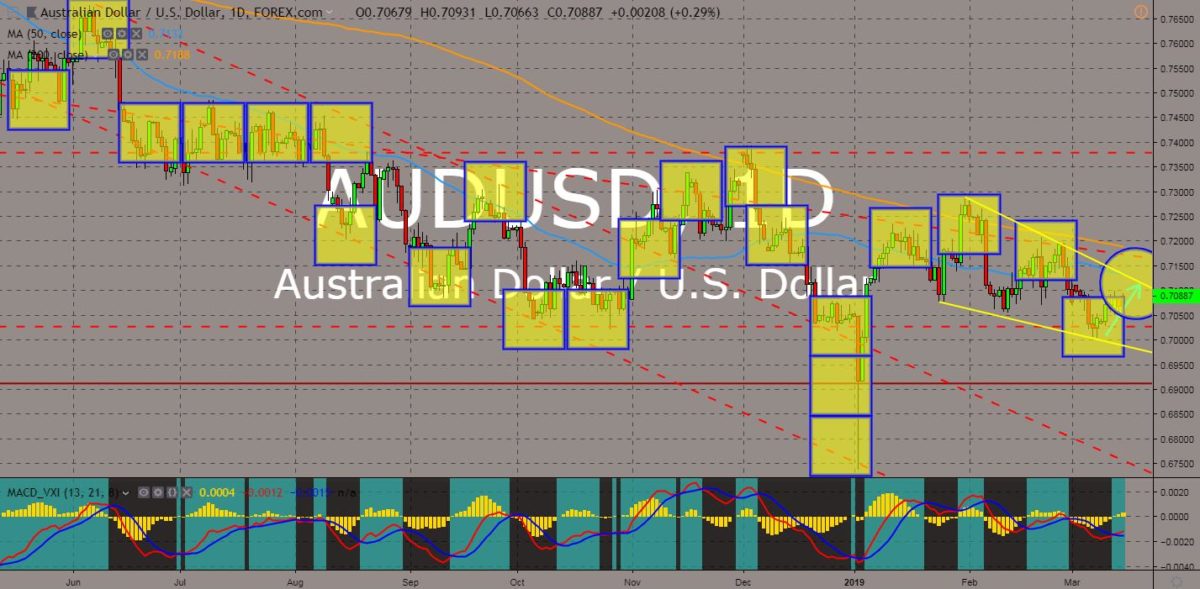
AUDUSD
The pair bounced back from the “Falling Wedge” pattern support line to retest its resistance line and try to break out from 50 MA. Australia and the United States had a renewed relationship with the new US Ambassador to Australia, Arthur Culvahouse. The new Ambassador attacks Chinese influence in the Pacific, which was also Australia’s concern. He described China’s loan to Pacific nations as “pay day loan”, or an unsecured loan, but international community simply called it the “debt trap”. Australia is the only remaining country among the Five Eyes Intelligence Alliance, aside from the United States, that didn’t withdraw its statement on the China’s Huawei. The United Kingdom said that the threats poised by the company is manageable, while New Zealand said that Huawei had never been excluded from building the country’s 5G infrastructure. Histogram and EMAs 13 and 21 continue to go up.
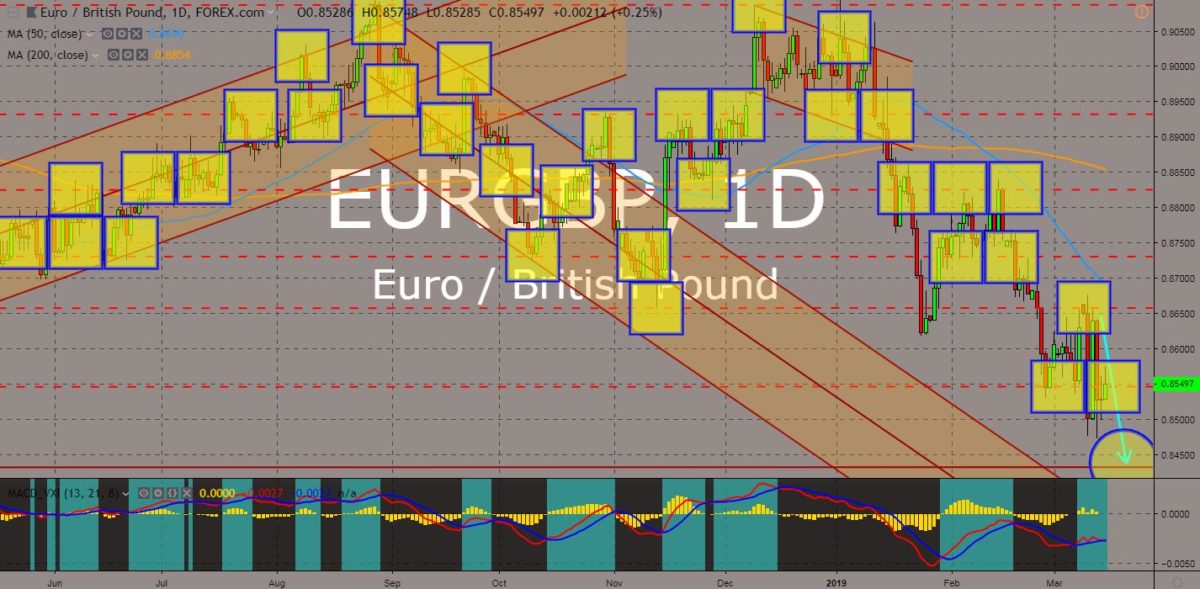
EURGBP
The pair had been widely volatile in the past few days indicating uncertainty over the future relationship between the United Kingdom and the European Union. For the second time, UK Prime Minister Theresa May’s deal was rejected by the UK Parliament. However, they also voted that the UK should not leave the bloc without a deal and the possibility of extending the Brexit was widely accepted by the MPs. With only fourteen (14) days remaining before the United Kingdom will officially leave the European Union, PM May and the Brussels are scrambling to strike a deal that will be approved both by the EU and the British Parliament. On the other side, the EU was divided if the bloc already needed to talk to the United States regarding their bilateral trade agreement after President Trump said that a potential US-UK trade deal will be unlimited. Histogram and EMAs 13 and 21 was expected to cross over.
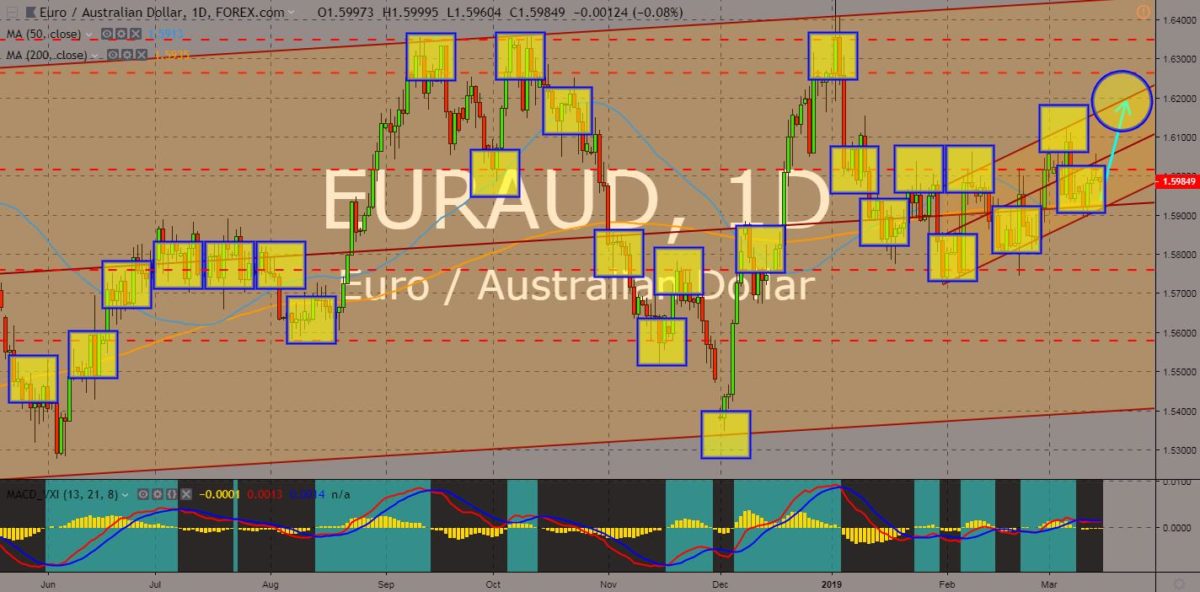
EURAUD
The pair was seen trading in an uptrend channel within another uptrend channel, with the pair set to bounce back from the support line to retest its resistance line. The divorce between the European Union and the United Kingdom had forced their allied countries to take sides in making a free trade agreement, and among these countries, Australia was seen to be the loser. Australia is a former British colony and had an existing trading agreement with the EU. However, the country was more in favor with the UK as it was the closes among the former colonies, the CANZUK (Canada-Australia-New Zealand-United Kingdom). The European Union punished this close ties by banning Australia’s wine and cheese industry in naming their products that would directly compete with EU’s businesses. Histogram was expected to shift into the bullish territory, while EMAs 13 and 21 will continue their upward movement.
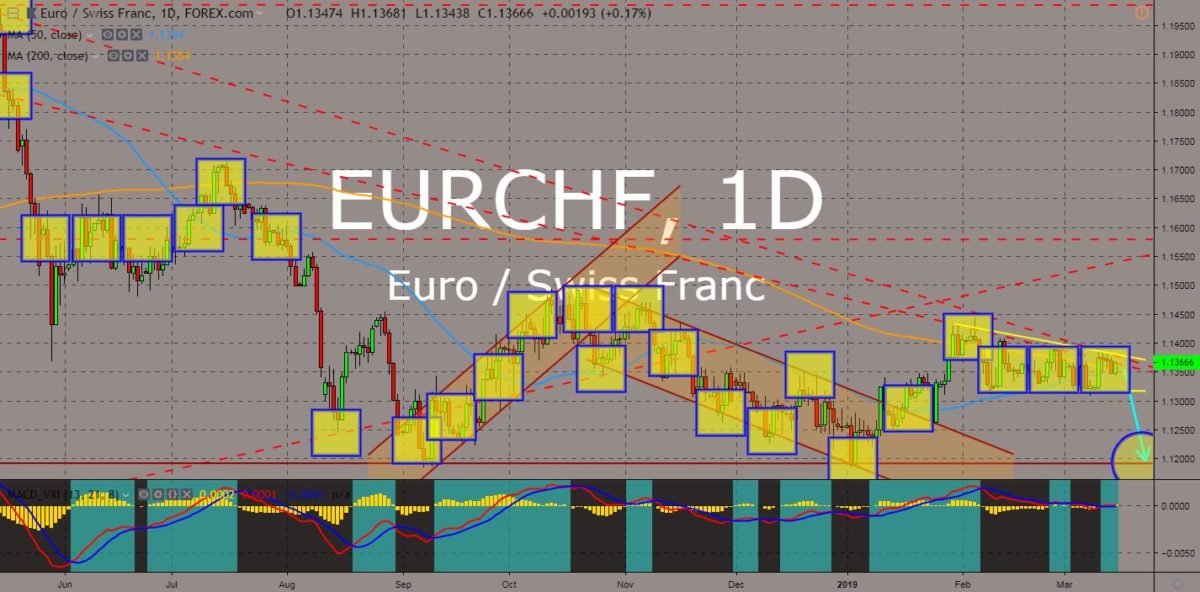
EURCHF
The pair was in a crucial position having the MAs 50 and 500 near its crossover, while trend lines shows the failure of the pair to break out of the down trend and “Descending Triangle” Resistance line. Switzerland was known as the most neutral country in the world, having its membership with the United Nations just began 15 years ago and despite the country being surrounded by EU members, Switzerland shrug off the possibility of holding a referendum that would introduce the accession of the country to the European Union. Switzerland was neither a member of the EU’s Single Market nor the EU’s Customs Union, but its relationship with the EU was built on a series of bilateral trade agreements, which allow Switzerland to gain access to the EU. It had recently signed a post-Brexit trading agreement with the UK, which angered the European Union. Histogram and EMAs 13 and 21 was seen to enter the bearish territory.


COMMENTS