

Here are the latest market charts and analysis for today. Check them out and know what’s happening to the market today.

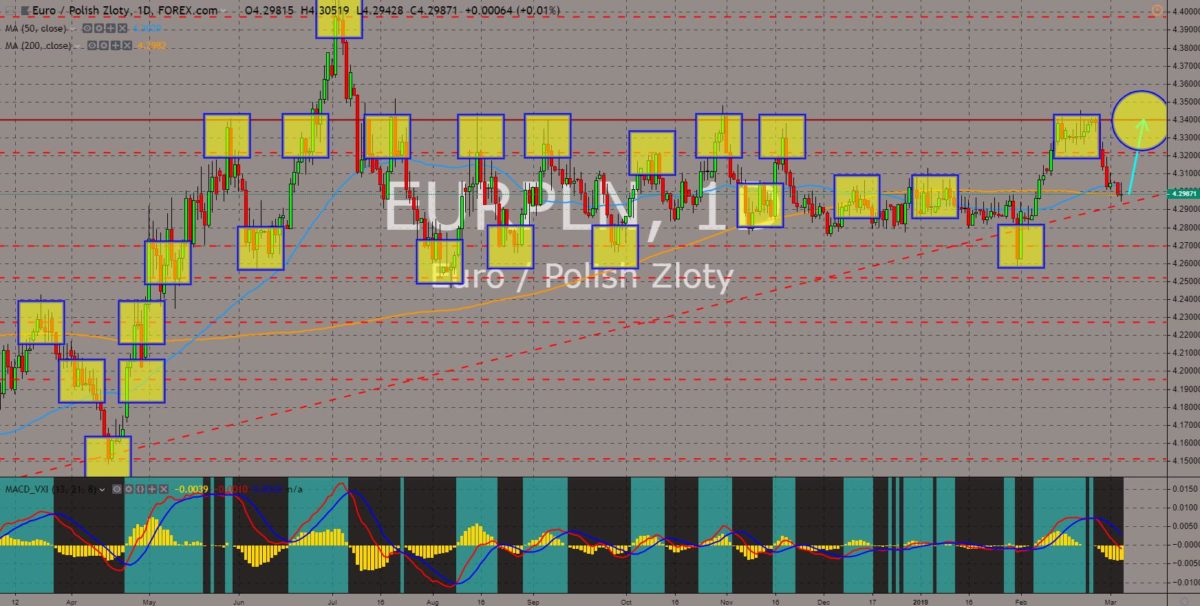
EURPLN
The pair was set for a rebound from 200 MA and to retest a major resistance line to reach an 8-month high, following the formation of the “Golden Cross”. The Visegrad group was a rising nationalist bloc inside the European Union. Hungary leads the campaign for nationalist candidates ahead of the European Parliamentary election, while Poland will establish an anti-EU bloc in case the nationalist candidates will not win during the election. However, the President of the European Council, Donald Tusk, was also a polish and had leveraged his influence to all his countrymen to not elect a nationalist candidate in the European Parliament. The relationship between the US and the Visegrad Group might not last as influencing the EU was not the US’ major motive, but to use them on its war with Russia. Histogram was already reversing towards a buying pressure, while EMAs 13 and 21 was expected to fall lower in the following days.
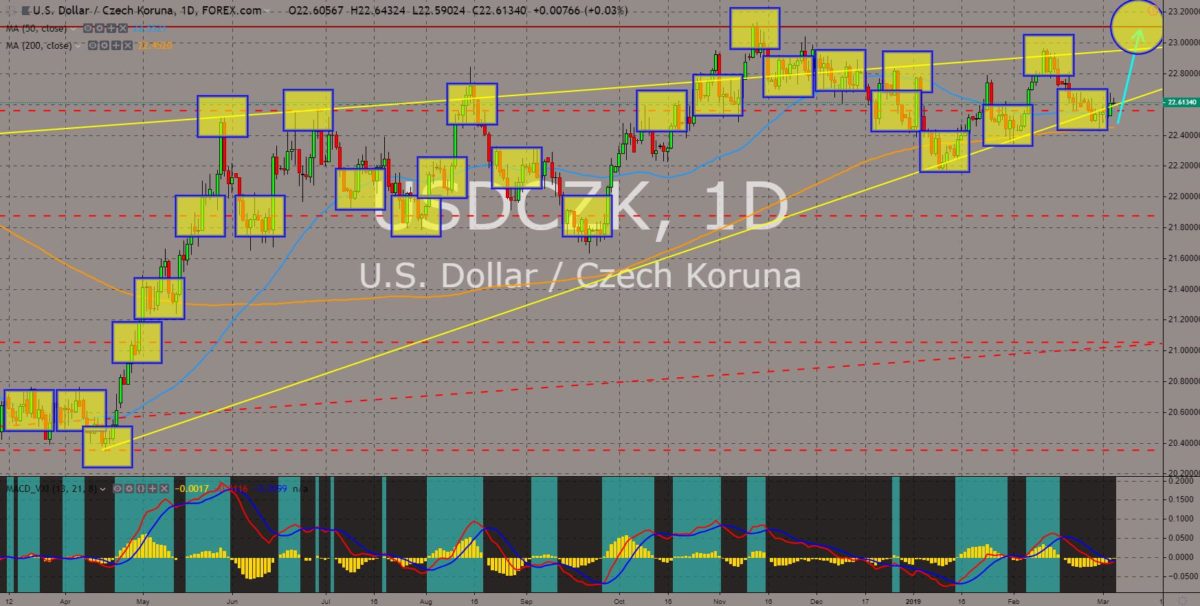
USDCZK
The pair bounced back from the long term “Rising Wedge” pattern, which signals a healthy uptrend for the pair. The Czech Republic is one of the members of the Visegrad Group, including Hungary, Poland, and the Slovak Republic. As the United States backed the Eastern bloc’s plan to win the majority in the European Parliament during the election, the US might also asked a favour in return for their support. The relationship between the United States and the European Union staled after US President Donald Trump pulled out the US from major accords and pacts, leaving the European Union to take the US’ role of promoting global stability. As the Five Eyes Intelligence Alliance defy Trump’s pressure to ban the Chinese technology company Huawei, he might ask the Eastern Bloc to ban the company amid security concerns. However, China’s Huawei warned the Czech Republic that it will file a lawsuit if it didn’t pull out its warning to the public. Histogram and EMAs 13 and 21 was seen to reverse.
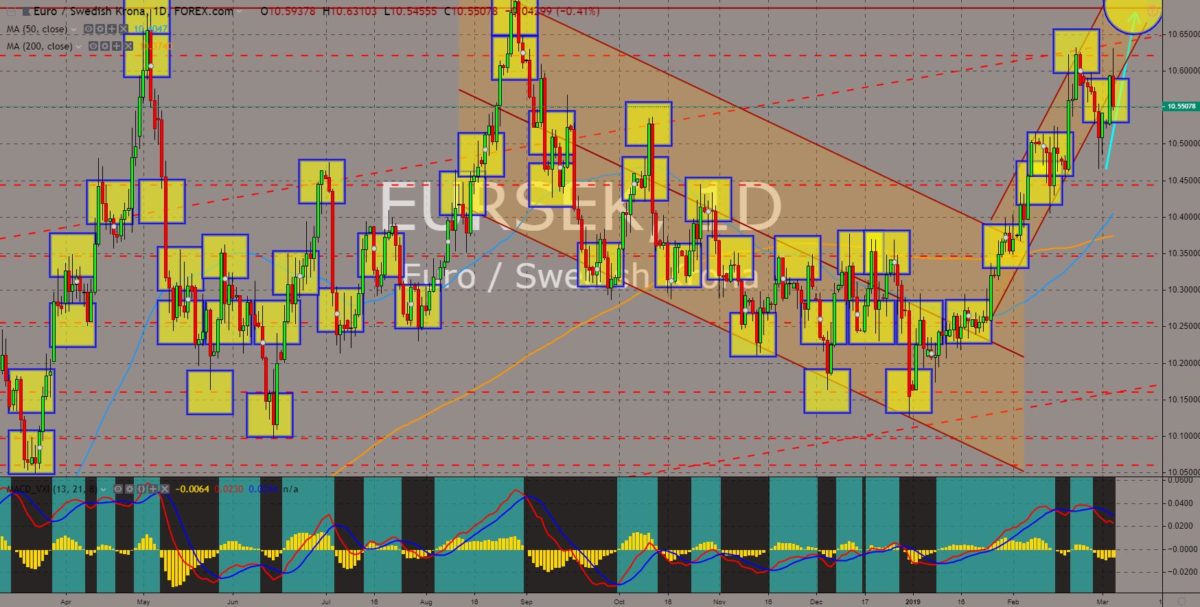
EURSEK
The pair will continue its rally after bouncing back from a steep channel, sending the pair to retest the channel resistance line. The plan of Switzerland to follow the United Kingdom’s step in withdrawing from the European Union dimmed down after the “Swexit” was off the country’s election menu. For the first time since joining the European Union in 1995, all Swedish political parties have now declared being in favour of staying in the EU. This is a win for the European Union following the rise of nationalist bloc and countries planning to withdraw from the bloc. This also mean that the Germany led EU was still on hold of the Baltic Sea, after the Russian annexation of Crimea, a Ukrainian territory, in the Black Sea. Ukraine was currently applying to become a member of the European Union and the NATO (North Atlantic Treaty Organization) Alliance. Russia has also an exclave territory between Poland and Lithuania in the Baltic Sea. Histogram and EMAs 13 and 21 will continue to go up.
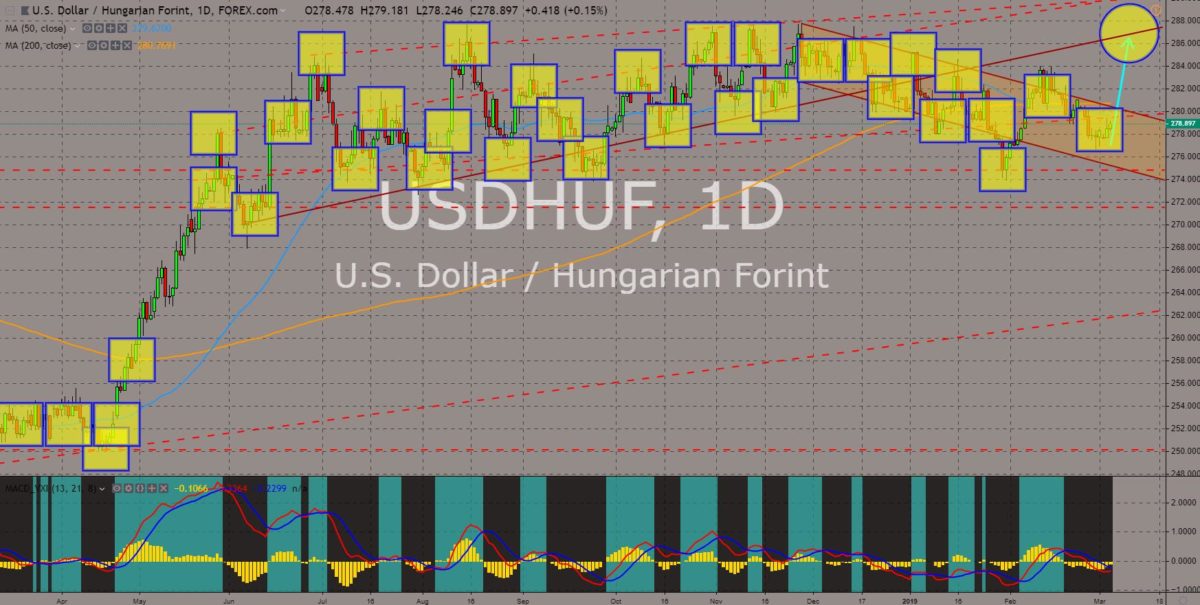
USDHUF
The pair was expected to break out of the down trend channel resistance line and retest its previous high from the uptrend resistance line. The United States backed the Eastern and nationalist bloc, the Visegrad Group. This was after the Germano-Franco led European Union promised to establish a European Army after German Chancellor Angela Merkel and French President Emmanuel Macron renewed their vows with the Aachen Treaty to lead the EU. The United States had signed a defense agreement with Hungary in line with Hungary’s defiance of the European Union. The Eastern Bloc are former Soviet satellite states, but had then transitioned to democracy following the collapse of the USSR (Union of Soviet Socialist Republics). Hungary is also set to open an embassy in Jerusalem from its current location, Tel Aviv, which signals that the United States is on control of the group’s future path. Histogram and EMAs 13 and 21 will continue its upward movement.


COMMENTS