

Here are the latest market charts and analysis for today. Check them out and know what’s happening to the market today.

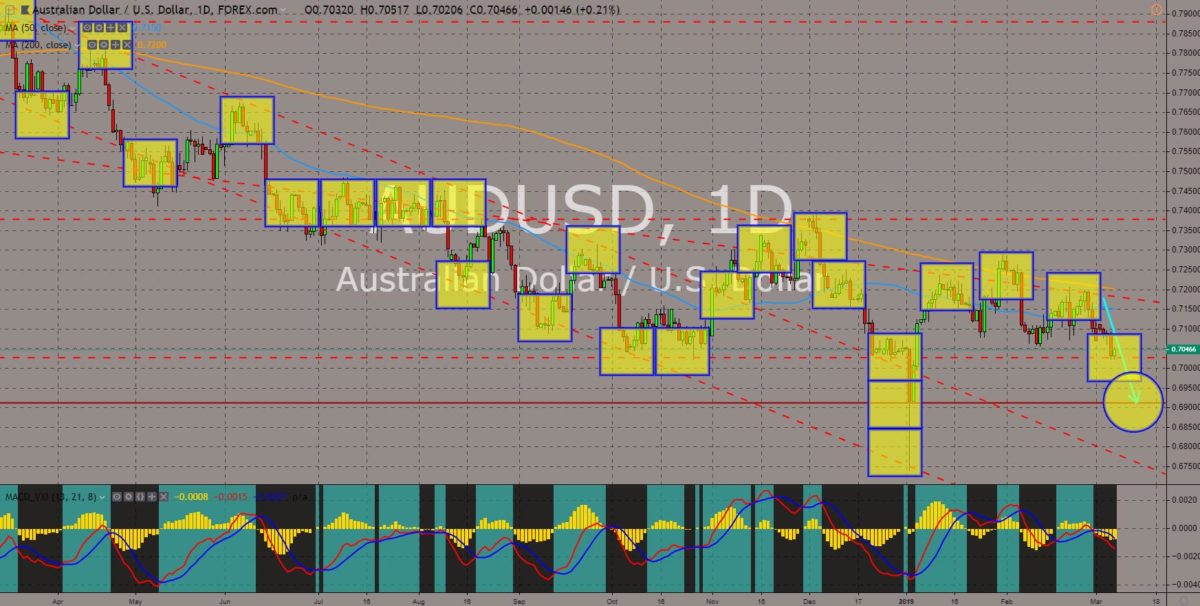
AUDUSD
The pair was seen to further go lower in the following days following the divergence of MAs 50 and 200. For the first time in three (3) decades, Australia entered a recession (on a per capita basis). Australia face many problems inside and outside the country, with the primary reason was due to the trade war between the United States and China. Australia consider China as its largest trading partner, way bigger than its neighbor New Zealand. The relationship between New Zealand and Australia was at its worst following New Zealand’s decision to take a different path from Australia. Australia will also face an impending federal election, with he incumbent Prime Minister Scott Morrison was seen to lose during the election. In case of a new Prime Minister, Australia will have its sixth Prime Minister in just a decade. Australia is also facing problem with the European Union after signing a free trade deal with the United Kingdom.
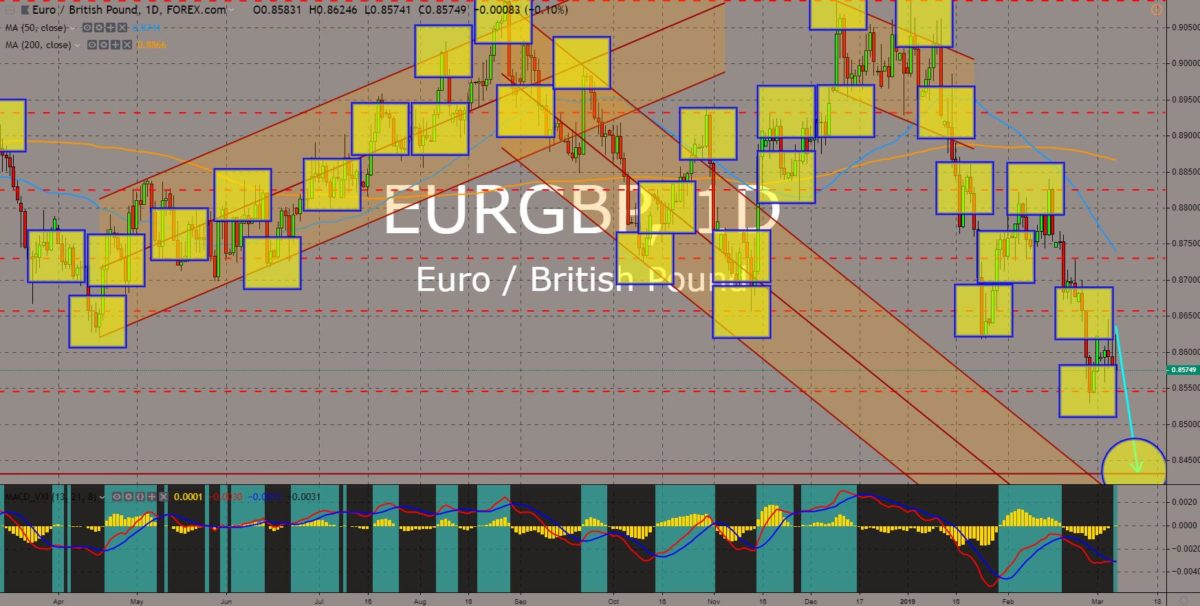
EURGBP
The pair will continue to fall lower in the following days with the formation of the “Death Cross”. The European Union offered a contrasting view with the withdrawal of the United Kingdom from the bloc saying that the UK will never receive the same treatment just like the remaining 27-member states. This was after Norway suggested a “Norway-Plus Brexit”, which means that the United Kingdom will remain in the EU Customs Union to prevent a hard border with the Republic of Ireland. Despite UK Prime Minister Theresa May having the problem on how she can strike a deal that will be approve by the UK Parliament and the European Union, the EU will still be largely affected given that the UK is the second largest economy in the Europe after Germany. The United Kingdom is the fifth largest economy in the world and will shake the global market with the Brexit. Histogram and EMAs 13 and 21 will fail to cross over.
EURAUD
MAs 50 and 200 shows divergence with the Price Action, after the pair broke out of the “Triangle Formation”, while the MAs formed the “Death Cross”. Australia will be desperate to make bilateral trade agreement with the European Union after the country entered a recession for the first time in three (3) decades. Australia has already a standing post-Brexit trading agreement with the United Kingdom. The European Union and the United Kingdom are looking towards the East to expand their influence as the two (2) will take different paths once the UK officially withdraws from the European Union. The European Union had also ratified the EU-Japan Free Trade Deal, which created the largest trading zone in the world, while the United Kingdom denied the possibility of making bilateral trade agreement with Japan until the UK official leaves the European Union. Histogram and EMAs 13 and 21 will continue its upward movement.

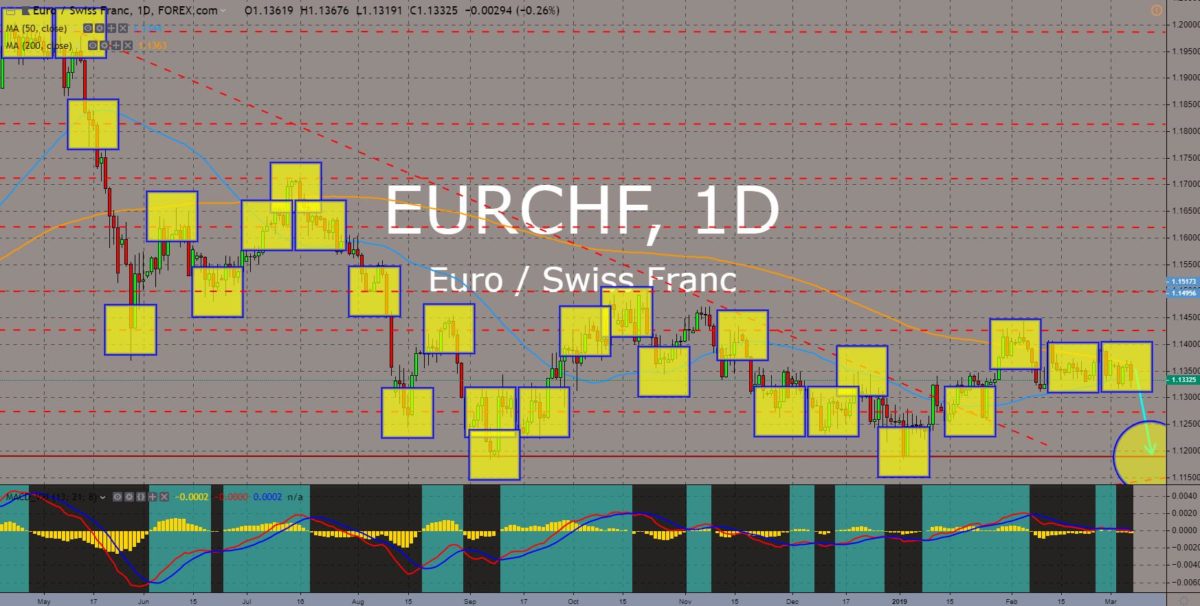
EURCHF
The pair was seen trading between MAs 50 and 200 with the likelihood of the pair failing to break out of 200 MA, which will send the pair to further go low. Switzerland was known as the most neutral country in the world by being a non-EU member, despite the countries surrounding it to be an EU member state. It was also one of the late countries to be a member of the United Nations. Despite this, Switzerland is important as it is located at the heart of Europe. However, the recent global issues make Switzerland to choose sides. Switzerland signed a bilateral trade agreement with the United Kingdom, despite its unwillingness to sign a framework which will incorporate all its trading agreement with the European Union. Switzerland is the only country to gain access with EU’s Single Market and Customs Union given that it was not a member of the European Union. Histogram and EMAs 13 and 21 was expected to be on a buying pressure.


COMMENTS