

Here are the latest market charts and analysis for today. Check them out and know what’s happening in the market today.

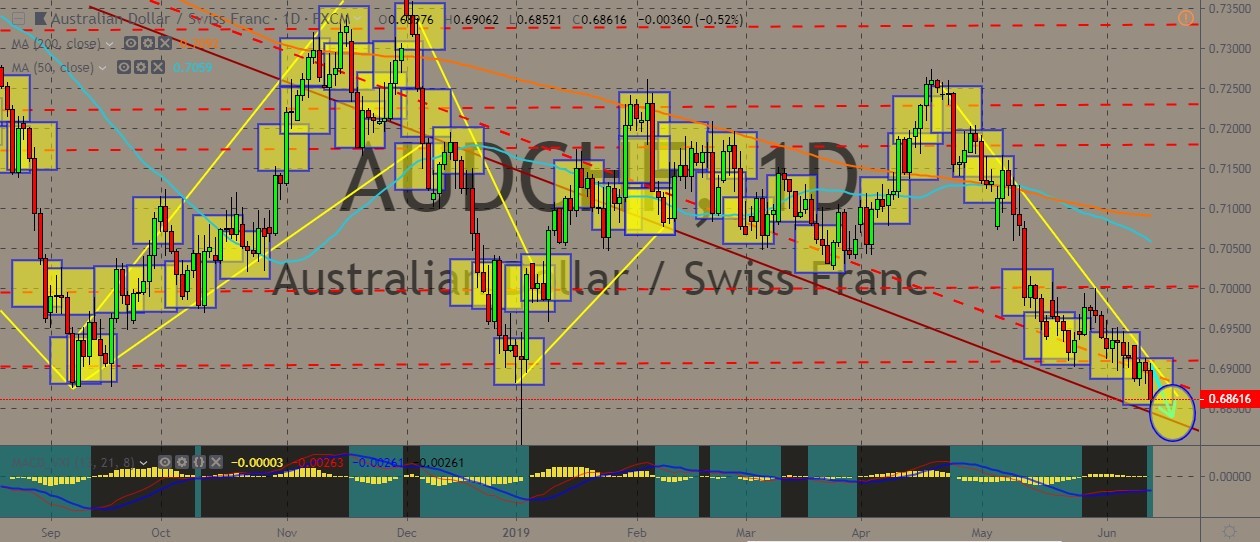
AUDCHF
The Australian dollar is showing broadened weakness against various currencies, including the Swiss franc. The AUDCHF pair is trading on lower lows, well below the 50- and 200-day moving averages that it recently converged with. The candlesticks are seen generally repeating the same pattern it showcased late last year. The Australian dollar was pressured by the lackluster jobs report that showed unemployment rate remained on the same levels in spite of the additional jobs that were also reported for May. Meanwhile, Switzerland is predicting a moderate economic growth for the year, citing risks from the ongoing US-China trade war as well as the uncertainties that revolve around Brexit and Italy’s financial problems. There’s a silver lining, however, as economists say that the Swiss growth will pick up next year. Meantime, traders should try to keep tight stops as the pair may continue to a downtrend.
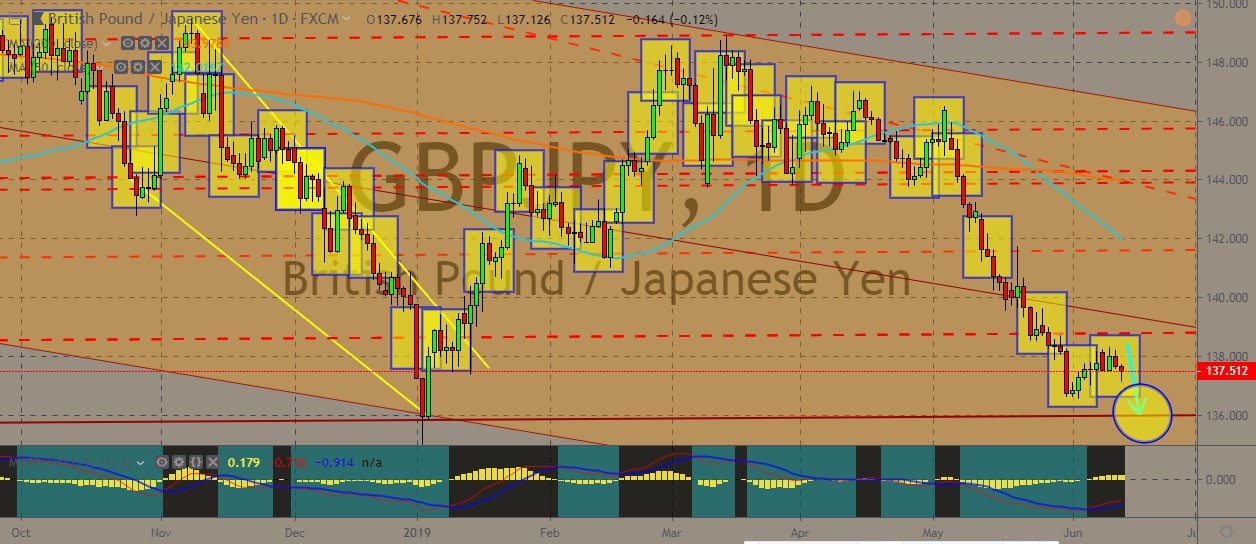
GBPJPY
The GBPJPY pair is still trading within a channel and near the lower band, as various political and economic factors weigh down the British pound and the enhances the safe haven appeal of the Japanese yen, which strengthened against various currencies. On the British side, traders managed to relatively support the pound as Borris Johnson, who is seen to be a favorite pick for the next prime minister for the United Kingdom, said that he doesn’t want a no-deal Brexit and says that the United Kingdom must saunter out of the European Union on 31 October. However, negative sentiment still reigns, boosting the Japanese yen, which extended its gains during the Asian trading session. Bullish traders on the Japanese yen managed to put the pair back down on the lower 137.000 levels. MACD indicator, on the other hand, indicates a possible reversal back up in the near term.
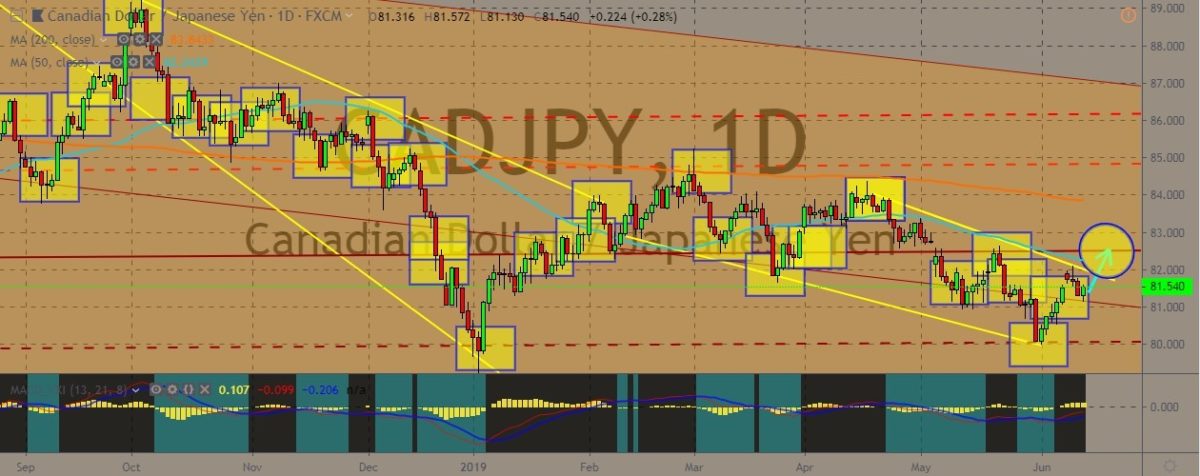
CADJPY
The pair is staying within the trading channel and moving slightly upwards the middle band of the channel, but still not as close as before to the 50-day moving average line. Trend lines appear to confirm a downward trend. Fundamentally, the Canadian dollar managed to gain some traction after the lower oil prices dampened expectations of interest rate cuts by the US Federal Reserve. Oil is Canada’s major export and it has been weighed down by weaker outlook for demand and an increase in US crude inventories in spite of the expectations of an extension of supply cuts by the Organization of Petroleum Exporting Countries. Canada also runs a current account deficit, and this means that the country might suffer if there is a slowdown in the global flow of trade or capital. On the charts, the pair could be going for a higher move as the current support line proves to be a solid one.
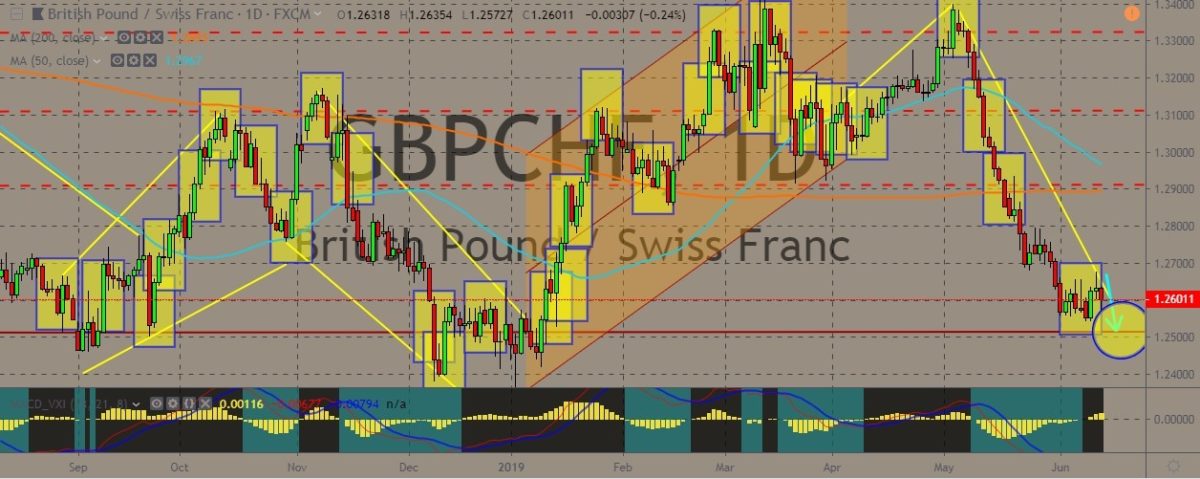
GBPCHF
The GBPCHF pair is seeing some volatility right now as traders saunter between trusting the GBP to perk up as more good political good news come in and seeking the safe-haven appeal of the Swiss franc in this time of political and economic uncertainty. After managing to reach some decent highs in May, the British currency has been pounded by negative political news that sent it spiraling down lower to previous bottoms, specifically the Brexit fiasco that is still holding the currency down. Although investors managed to take heart after news that a no-deal Brexit could still be avoided, the safe-haven Swiss franc still maintains its popular status among risk-averse investors, who are now starting to steer clear of risky assets and other commodity-based currencies. Overall, the pair’s movement will be dictated by the developments in the Brexit saga and the levels of trust the traders could give back the GBP should good news arrives.


Pretty! This has been a really wonderful article. Many thanks for supplying this information.|